
Key Takeaways
Here are some most important mobile game statistics at a glance:
- Mobile games generated about $103 billion in revenue in 2025, contributing roughly 55% of total global gaming revenue and maintaining dominance over console and PC gaming.
- The global mobile gaming market reached approximately $143.96 billion in 2025 and is expected to grow further as smartphone adoption and mobile-first entertainment continue expanding worldwide.
- Around 2.85 billion people actively play mobile games globally, making mobile devices the most widely used gaming platform and significantly expanding access beyond traditional gaming audiences.
- Mobile game downloads reached approximately 50.4 billion in 2025, indicating massive scale while showing the industry’s transition from rapid acquisition growth toward stronger retention and monetization strategies.
- Players spent more than 444 billion hours inside mobile games during 2025, proving engagement levels remain extremely strong despite slowing download growth across mature gaming markets.
- Mobile gamers now represent more than half of the global gaming population, confirming that mobile-first development and marketing strategies are essential for long-term industry growth.
It’s only a snapshot of the major mobile game statistics you’ve just explored. The real insights begin when we connect those numbers to market direction, player intent, and growth strategy.
Mobile gaming is no longer about downloads alone. It has changed a lot to performance-based now, which depends on revenue distribution, engagement depth, retention strength, and how effectively studios respond to evolving player expectations.
They are competing for time, loyalty, and lifetime value. Retention systems, live-ops design, balanced monetization, and community-led engagement are also becoming important considerations.
For marketers, statistics expose rising acquisition costs, regional growth pockets, and the direct relationship between ad performance, engagement quality, and long-term profitability.
Therefore, in this blog, we’ll explore more than 60+ mobile gaming statistics that reveal where the industry is heading, helping studios and marketers make sharper growth, monetization, and positioning decisions.
Mobile Gaming Market Size and Revenue Statistics
So, how big is the mobile gaming market today, and where is most revenue actually generated? Let’s look at reports showing mobile gaming revenue and market size growth.
- Mobile games generated approximately $103 billion in global revenue in 2025, representing nearly 55% of total gaming industry revenue. (Newzoo)
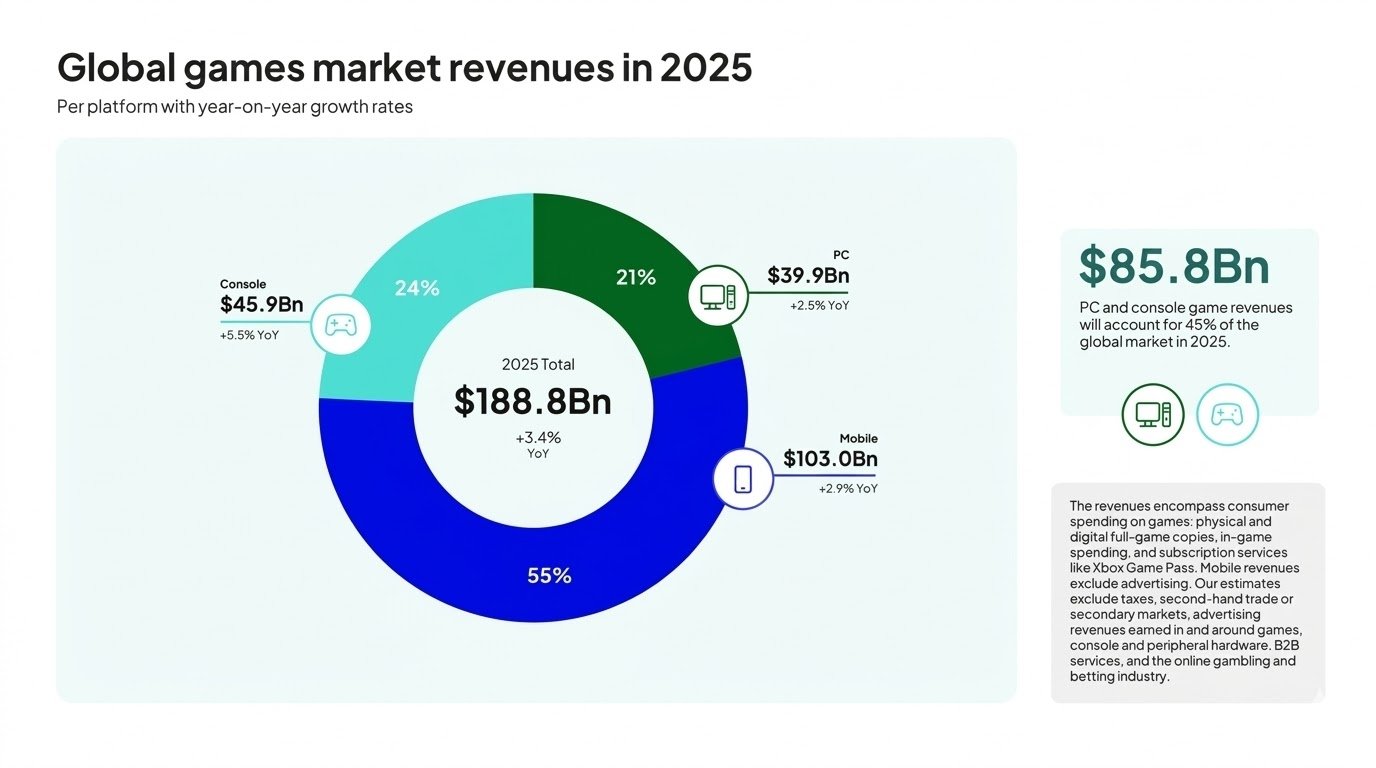
- The global games market reached about $189 billion in 2025, with mobile gaming contributing the largest share among all gaming platforms. (Newzoo)
- Mobile gaming revenue grew around 2.9% year-over-year, showing steady financial expansion even as overall market growth stabilized across mature regions. (PocketGamer)
Now, looking more deeply into revenue distribution can help us understand which countries drive the majority of global mobile gaming earnings today.
- Top Mobile Game Markets by Revenue:
| Country | Mobile Game Revenue (USD) |
| United States | $26.12 billion |
| China* | $12.47 billion |
| Japan | $10.62 billion |
| South Korea | $5.27 billion |
| Germany | $2.89 billion |
*China figures exclude third-party Android marketplace data, which may mean total revenue may be higher than reported estimates.
- The United States accounts for the largest share of global mobile game revenue, supported by strong consumer spending across App Store and Google Play ecosystems. (TensorTower)
- Japan remains one of the highest-revenue mobile gaming markets globally, generating nearly $11 billion through in-app purchases alone. (TensorTower)
Mobile Game User and Player Demographics
Understanding who plays mobile games is critical for forecasting growth, targeting audiences, and optimizing monetization strategies across regions.
Here’s what statistics reveal about game user’s demographics:
- The global games market reached about 3.6 billion players worldwide in 2025, with mobile representing the largest share of total gamers. (Newzoo)
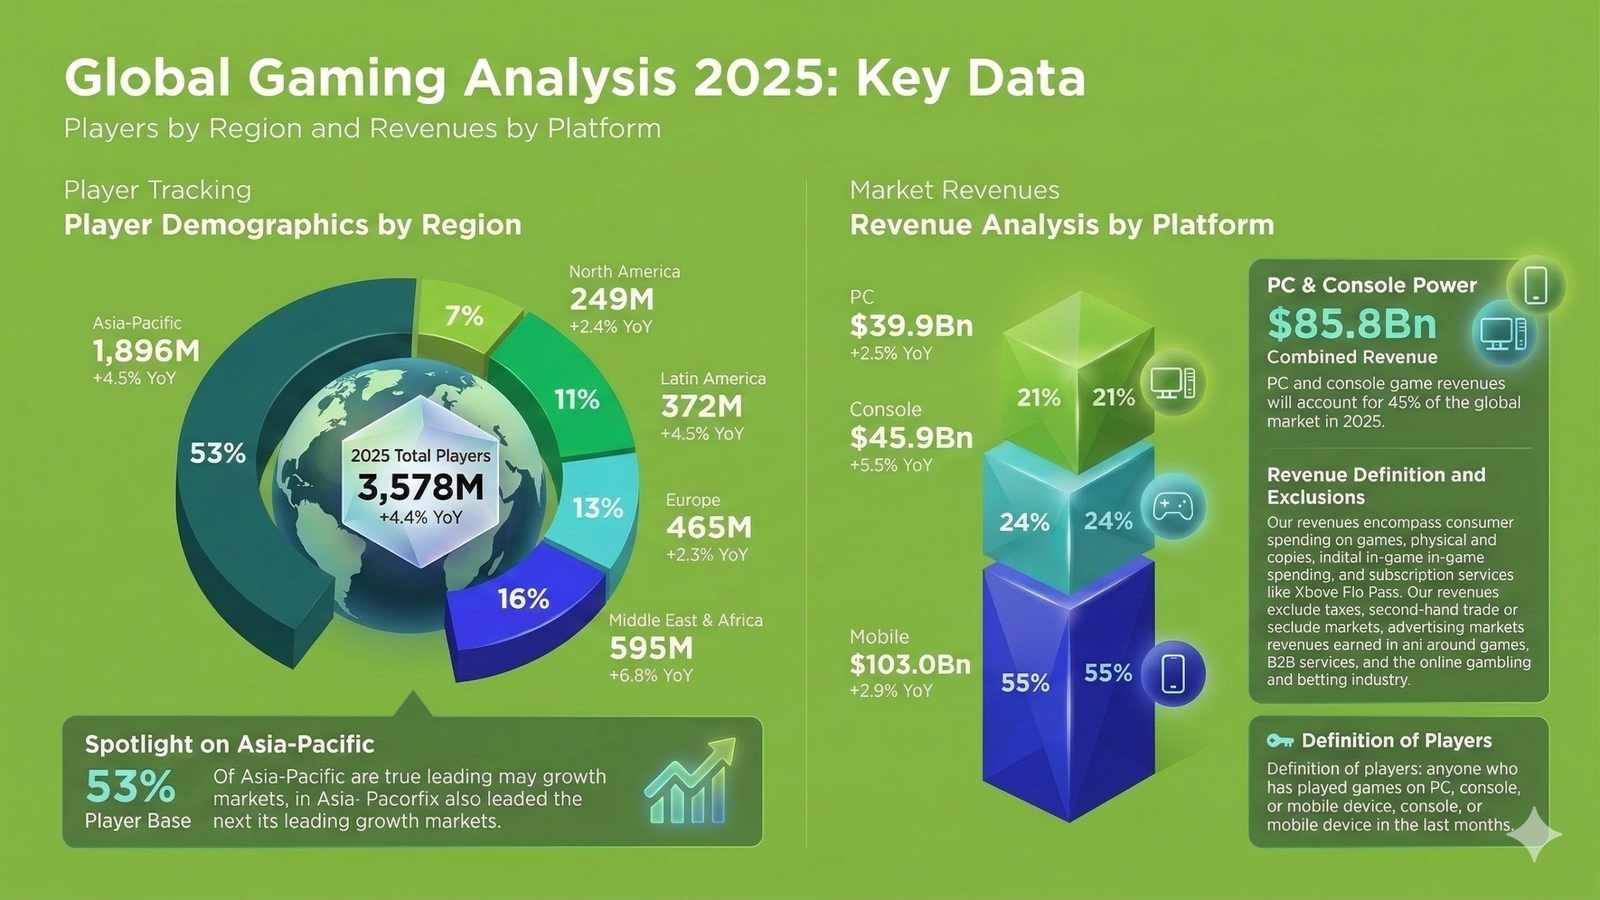
- Asia-Pacific hosts approximately 1.89 billion players, accounting for nearly 53% of the global gaming population. (MAF)
- North America represents around 249 million players globally, while Europe contributes nearly 495 million players across gaming platforms. (MAF)
- Here’s some data showing you the mobile gamers’ age distribution globally: (Udonis)
| Age Group | Share of Players |
| 18–34 | ~38% |
| 35–44 | ~14% |
| 45–54 | ~12% |
| 55+ | ~16% |
- Around 80% of global gamers are aged over 18, showing gaming has become a mainstream adult entertainment activity rather than a youth-only behavior. (Keywords Everywhere)
- The 18–34 age group remains the largest player segment globally, exceeding one billion players worldwide. (Keywords Everywhere)
- Mobile gaming audiences show balanced participation across genders, with female players representing nearly half of the global gaming population.
Mobile Game Downloads and Installation Trends
As download behavior reveals how quickly players discover new games and which markets continue driving global install volume across app stores.
So, here are important mobile game download statistics highlighting annual installs, monthly acquisition scale, geographic leaders, and genre performance across global app marketplaces.
- Mobile games recorded approximately 50.4 billion downloads worldwide in 2025 across the App Store and Google Play combined. (Game World Observer)
- Global mobile game downloads declined by about 7.2% year-over-year, marking the second consecutive year of reduced install growth. (Game World Observer)
- Looking closer at geographic distribution helps identify which countries dominate global download volume. Here are the top mobile game markets by downloads:
| Country | Annual Downloads / Market Share |
| India | ~15.5% global share |
| United States | ~8% global share |
| Brazil | ~7.8% global share |
- India remains the world’s largest mobile gaming market by downloads, driven by affordable smartphones and expanding mobile internet accessibility. (Sensor Tower)
- In January 2025 alone, mobile games generated more than 4.41 billion downloads globally, showing the massive scale of monthly acquisition activity. (Sensor Tower)
- Puzzle and simulation genres each captured roughly 20% of total downloads, leading install volume across global mobile game categories. (BYYD)
- Arcade games have maintained nearly 19% of download share despite declining installs, showing continued demand for simple, accessible gameplay experiences. (BYYD)
Mobile Game Engagement and Retention Statistics
Player engagement determines whether downloads convert into long-term success. The following statistics highlight how often players return, how long they play, and what retention benchmarks look like globally.
- Mobile gamers collectively spent 444.63 billion hours playing games in 2025, showing sustained engagement despite slowing download growth. (Game World Observer)
- Global mobile gaming sessions increased by 12% year-over-year, while total time spent grew by nearly 7.9%, indicating deeper player interaction. (Sensor Tower)
- The average mobile game session length ranges between 4–5 minutes across most games, with top-performing games reaching 7–8 minutes per session. (Coopboard Games)
- Retention also plays an important role in mobile gaming. So, here are some top retention benchmarks you need to know:
| Retention Stage | Average Performance |
| Day 1 (D1) | ~22.9% |
| Day 7 (D7) | ~4.2% |
| Day 28 (D28) | ~0.85% |
- Top-performing mobile games achieve Day-1 retention rates above 26–31%, significantly outperforming industry median benchmarks. (SQ Magazine)
- Hybrid-casual and mid-core games record some of the strongest early retention, exceeding 40% Day-1 retention in leading categories. (SQ Magazine)
- Games implementing daily rewards and progression systems improve 30-day retention by nearly 19% compared to static gameplay structures. (SQ Magazine)
- Now, look at some average engagement behavior across gaming players, which shows how often they interact with your games:
| Metric | Industry Average |
| Daily Sessions per User | ~2.4 sessions |
| Average Daily Playtime | ~26 minutes |
| Top Quartile Session Time | 7–8 minutes |
- Android players average about 26.6 minutes of gameplay daily, opening games multiple times per day across live-service.
- Games category apps maintain the highest session duration among all mobile app categories, exceeding 30 minutes on average usage time. (Coopboard Games)
Mobile Game Monetization and Spending Behavior
Player spending defines how mobile games sustain long-term growth. The statistics below highlight how revenue is generated, how frequently players spend, and how monetization patterns continue evolving globally.
- Mobile gamers spent about $82 billion on in-app purchases worldwide in 2024, marking a return to revenue growth after a previous market slowdown. (Sensor Tower)
- In-app purchase revenue increased roughly 4% year-over-year, showing steady expansion despite declining global download volumes. (Sensor Tower)
- Global in-app purchases across mobile apps reached $40 billion in Q1 2025 alone, demonstrating the massive recurring spending behavior within mobile ecosystems. (Sensor Tower)
- Strategy, puzzle, and hybrid-casual games contributed the largest share of monetization growth across Western markets.
- Hybrid-casual games recorded nearly 37% year-over-year growth in in-app purchase revenue, making them one of the fastest-growing monetization categories. (Sensor Tower)
- Mobile gaming remains the largest contributor to consumer spending across app stores compared with other app categories.
- Recurring purchases through events, battle passes, and live content updates continue driving consistent revenue flow throughout the year.
Mobile Game Advertising and User Acquisition Stats
Acquiring players has become one of the most competitive areas in mobile gaming.
Below are some highlighted advertising spend, acquisition costs, and performance benchmarks shaping modern user growth strategies.
- Mobile gaming companies spent approximately $25 billion globally on user acquisition campaigns in 2025, showing continued investment in paid player growth. (MAF)
- Total global app user acquisition spending reached about $78 billion in 2025, with gaming contributing nearly $25 billion of that total marketing investment. (AppsFlyer)
- Paid install share increased by nearly 10% year-over-year, indicating stronger reliance on performance marketing channels for scaling new game launches. (AppsFlyer)
- Average cost-per-install (CPI) varies significantly by platform and genre, reflecting differences in competition level and monetization potential. Some benchmark data:
| Platform / Genre | Average Cost per Install (CPI) |
| Android (Average) | ~$3.40 |
| iOS (Average) | ~$4.70 |
| Hyper-casual Games | <$1.00 |
| Casual Games | $2.00–$3.00 |
| Mid-core Games | $3.00–$5.00 |
- iOS acquisition costs remain significantly higher than Android, reflecting stronger monetization potential and higher player lifetime value expectations.
- Apple Ads ranked as the leading acquisition channel for iOS gaming globally, while AppLovin and Meta Ads remained dominant performance networks across Western markets.
- Gaming advertising spend surpassed $8.7 billion year-to-date in 2025 across tracked campaigns, highlighting sustained competition for player attention. (Sensor Tower)
- Ad impressions across gaming campaigns grew nearly 20% year-over-year, showing increasing reliance on large-scale creative testing and multi-channel distribution.
Genre-Wise Mobile Game Performance Statistics
Different genres drive mobile gaming performance in different ways. The statistics below highlight which categories dominate downloads and which generate the highest revenue globally.
- Strategy games became the top-grossing mobile genre in 2025, recording about 23% yearly revenue growth across tracked markets.
- Puzzle and simulation games each captured nearly 20% of total global mobile game downloads, leading in install volume worldwide. (BYYD)
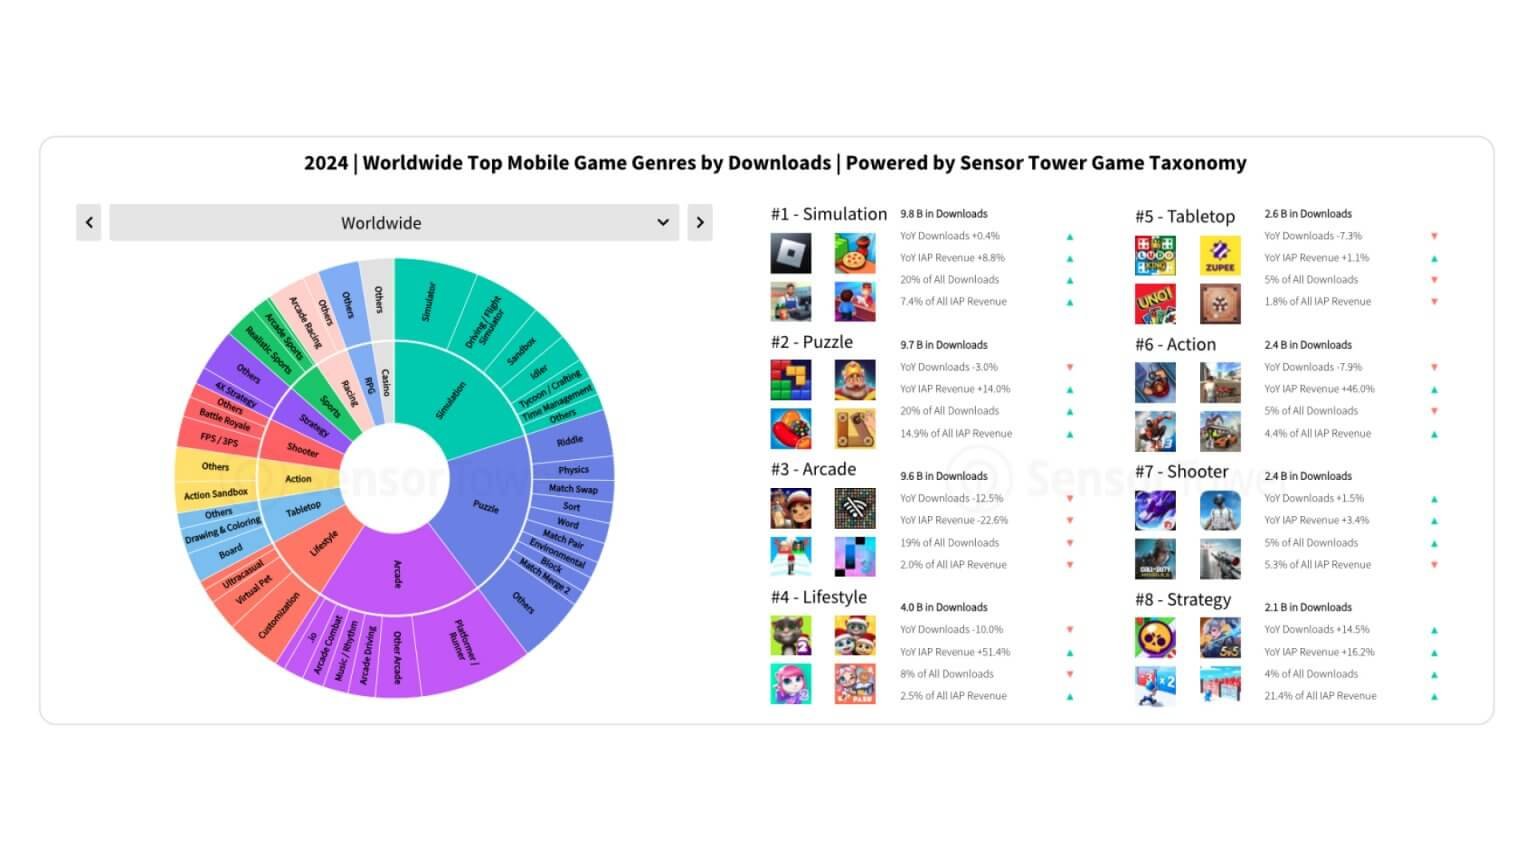
- Arcade games maintained roughly 19% of total downloads despite declining installs, showing continued demand for lightweight and accessible gameplay experiences. (BYYD)
- Casual games delivered the strongest revenue growth across Western markets, supported by live-ops updates and recurring engagement models.
- Role-playing games (RPGs) continue ranking among the highest revenue-generating genres due to strong monetization systems and long player lifecycles.
- Hybrid-casual games recorded one of the fastest monetization expansions, combining simple gameplay loops with deeper progression mechanics.
Regional Mobile Gaming Statistics
Regional performance explains where mobile gaming growth is accelerating and which markets contribute the largest share of global industry revenue.
- Asia-Pacific accounts for more than 52% of global gaming revenue, making it the largest regional gaming market worldwide.
- The region generated over $87 billion in gaming revenue, supported by massive player populations across China, Japan, and Southeast Asia.
- North America produced approximately $50.6 billion in gaming revenue, remaining one of the highest-spending mobile gaming regions globally. (Udonis)
- Europe contributed around $33.6 billion in gaming revenue, showing stable growth driven by mature monetization markets. (Udonis)
- India remains the world’s largest mobile gaming market by downloads, surpassing 8.45 billion installs annually. (Sensor Tower)
- Latin America recorded some of the fastest regional growth rates, with Brazil emerging as a major expansion market for mobile publishers.
Mobile Gaming Growth Projections and Future Outlook
Where is mobile gaming heading next, and how fast is the industry expected to grow?
We’ve gathered a few projections that highlight revenue forecasts, player expansion, and long-term market direction based on industry reports.
- The global games market is projected to grow from $188.8 billion in 2025 to approximately $206.5 billion by 2028, reflecting steady long-term industry expansion. (Newzoo)
- Global player numbers are expected to increase from 3.6 billion players in 2025 to nearly 3.9 billion players by 2028. (Newzoo)
- Mobile gaming is forecast to remain the largest gaming segment, generating around $108 billion in revenue while maintaining roughly 55% market share. (Newzoo)
- Mobile gaming revenue growth is expected to continue at a moderate pace as the industry shifts toward sustainable monetization and long-term player retention strategies.
- Future market growth indicators highlight projected expansion across revenue and player base over the next several years. So, here’s what it looks like in real:
| Metric | 2025 Projection | 2028 Projection |
| Global Games Revenue | $188.8 billion | $206.5 billion |
| Total Global Players | 3.6 billion | ~3.9 billion |
| Paying Players | 1.6 billion | ~1.8 billion |
| Average Spend per Payer | $119.70 | $124.50 |
- Long-term forecasts indicate consistent annual market growth near 3–4%, signaling a mature yet stable expansion phase for the global gaming industry.
Conclusion: What’s Next?
Mobile gaming is no longer defined by rapid expansion. The statistics across revenue, users, downloads, engagement, and monetization clearly show how the industry is entering a more strategic growth phase.
Today, success now depends less on acquiring massive installs and more on building retention-driven player acquisition for higher engagement growth.
As markets continue to expand, and competition is intensifying. Gaming publishers that understand regional trends, genre performance, and acquisition efficiency are more likely to position themselves strongly in an increasingly mature mobile gaming landscape.
Therefore, teams that interpret industry data correctly and adapt faster to changing player behavior and market dynamics will adapt more towards high-potential game growth as well as increase visibility for their games even in a competitive landscape.
Sources: Newzoo, PocketGamer, SensorTower, MAF, Udonis, Keywords Everywhere, Game World Observer, BYYD, Coopboard Games, SQ Magazine, AppsFlyer