
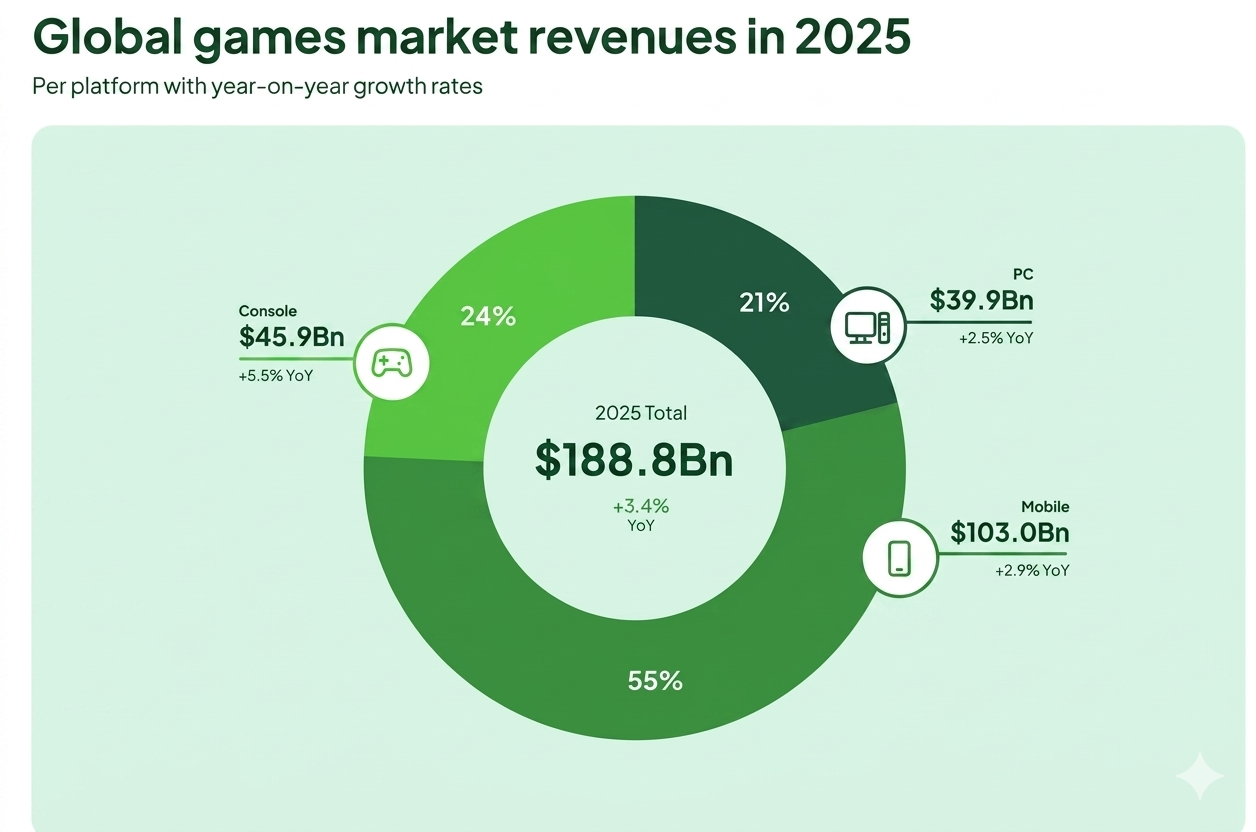
The global games market stands at $188.8 billion in 2025, reflecting a 3.4% year-over-year growth with strong industry resilience.
Video games are no longer just entertainment products. They influence digital behavior, technology adoption, and global consumer spending patterns significantly.
The global video game player base is expected to reach around 3.6 billion users, reflecting continuous growth across platforms worldwide.
Understanding video game statistics is essential for developers and marketers aiming to build, position, and scale successful games effectively. These statistics reveal how players behave, which platforms dominate, and where revenue opportunities are expanding rapidly across the ecosystem.
Before you dive, here are some key video game statistics shaping the industry:
- Mobile video games generated approximately $103 billion in revenue, contributing over 55% of total global video game earnings.
- PC video games generated around $75.4 billion in revenue, driven by both premium titles and free-to-play ecosystems.
- The global esports audience reached between 640 million and 678 million viewers, highlighting the growing influence of competitive video games.
- Cloud gaming supported over 58 million active users worldwide, showing increasing adoption of streaming-based video game access.
In this blog, you’ll explore the most important video game statistics covering market size, players, revenue, platforms, and engagement trends.
More importantly, you’ll understand what these video game statistics mean and how they guide smarter decisions in game development and marketing.
Global Video Game Market Size Statistics
The global video game industry continues to expand steadily, supported by increasing digital adoption and consistent demand for interactive entertainment worldwide.
Market growth has stabilized after the pandemic surge, but revenue continues rising through content expansion, platform ecosystems, and global player spending patterns.
Here are the most important global video game market size statistics:
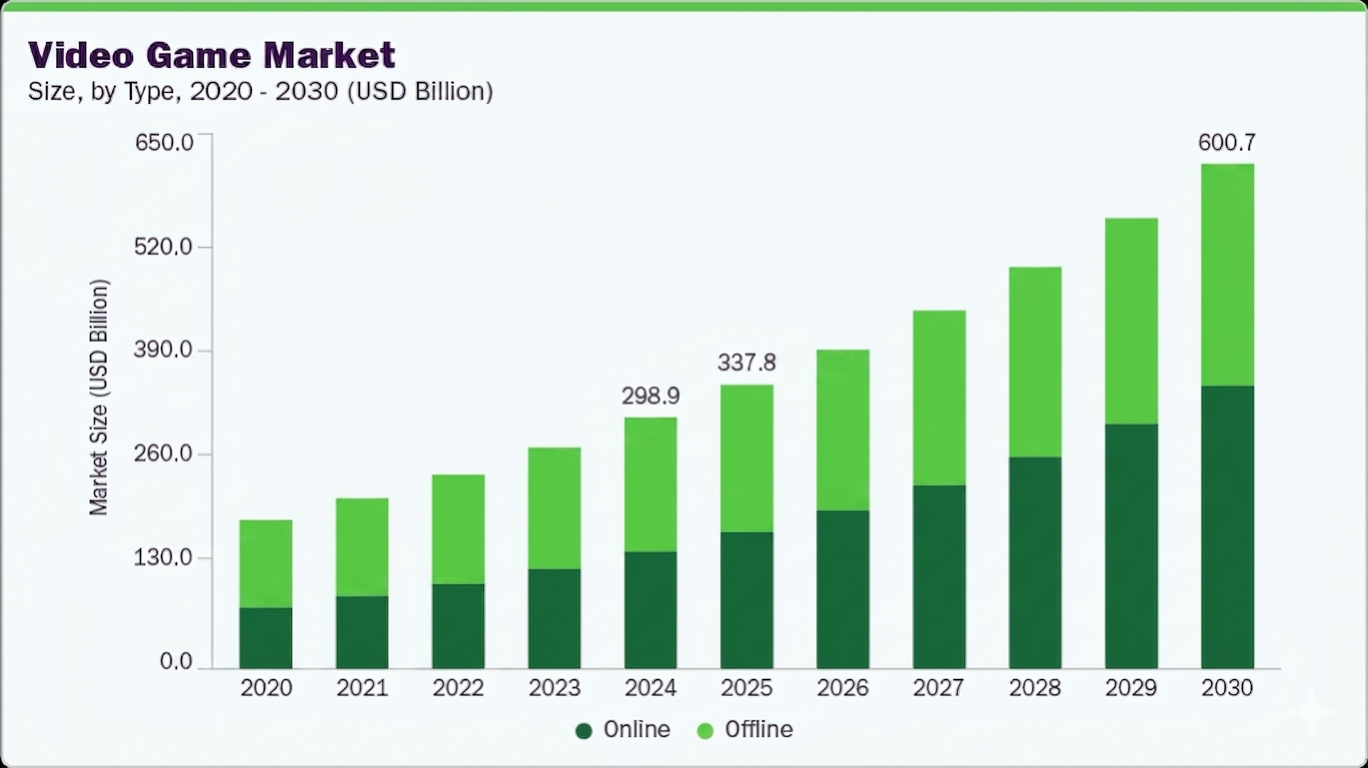
- The global video game market size was estimated at $298.98 billion in 2024, reflecting strong industry expansion across platforms.
- The video game market is projected to reach $600.74 billion by 2030, driven by long-term demand for interactive entertainment.
- The industry is expected to grow at a CAGR of 12.2% from 2025 to 2030, indicating sustained global market expansion.
- Digital game distribution now accounts for up to 80% of video game sales for major publishers, replacing physical game purchases globally.
- Sony, Microsoft, and Nintendo together generated over $60.3 billion in annual video game revenue, dominating the global console gaming market.
Total Number of Video Game Players Worldwide
The global video game audience is spread across regions, platforms, and spending behaviors today, shaping how publishers measure reach.
Player distribution now highlights where engagement is concentrated, helping studios understand which regions drive scale and long-term player growth.
Here are the most important video game player statistics:
- Asia-Pacific accounted for 1.9 billion players in 2025, representing 53% of the global video game player base overall.
- PC gaming reached 936 million players, while console gaming reached 645 million players worldwide in 2025 across major markets.
- More than 60% of the global online population plays video games, showing how deeply gaming penetrates connected audiences worldwide.
- China recorded 723 million players, followed by the United States with 224.8 million and Brazil with 123.3 million players globally.
Here are some more countries representing their video game player statistics worldwide:
| Market | Revenue (USD) | Players |
| China | $53.2B | 723.0M |
| United States | $49.8B | 224.8M |
| Japan | $17.6B | 74.1M |
| South Korea | $7.8B | 34.0M |
| Germany | $7.0B | 53.2M |
| United Kingdom | $6.6B | 43.4M |
| France | $4.1B | 40.2M |
| Canada | $3.1B | 24.4M |
| Brazil | $2.7B | 123.3M |
| Mexico | $2.7B | 78.1M |
Video Game Revenue Statistics
Video game revenue reflects how players spend across platforms, including their business models and content ecosystems, shaping how the industry generates consistent global income.
Revenue growth is increasingly driven by player spending depth, live-service ecosystems, and high-performing video games rather than rapid expansion in total players.
Here are the most important video game revenue statistics:
- PC and console video game software revenue reached $85.2 billion in 2025, showing a strong contribution from premium and live-service video games.
- PC video game revenue is projected to grow at a 6.6% CAGR through 2028, outpacing console revenue growth globally.
- Console video game revenue growth is expected at 4.4% CAGR through 2028, driven mainly by blockbuster releases and hardware cycles.
- Microtransactions accounted for 48% of total PC video game revenue in 2025, generating approximately $20.6 billion globally.
- Premium game sales contributed around 29% of PC video game revenue, highlighting continued demand for full-price titles worldwide.
- Subscription-based video game revenue continues growing steadily, supported by services like Game Pass and PlayStation Plus ecosystems.
Mobile Video Game Statistics
Mobile video games now represent the largest segment of the global video game industry by both revenue and player base worldwide.
Here are the most important mobile video game statistics:
- Mobile video games generated $103 billion in revenue in 2025, accounting for approximately 55% of total global video game revenue
- The global mobile gaming market is projected to reach $126 billion in 2025 and surpass $160 billion by 2030.
- More than 2 billion players worldwide actively play mobile video games, making it the largest gaming platform by users.
- Mobile video game downloads reached approximately 49 billion in 2024, reflecting high global adoption despite slowing install growth.
- In-app purchases generated over $82 billion in 2024, forming the dominant revenue stream within mobile video game ecosystems.
- Games remain the largest category on app stores, accounting for nearly 12% of all available apps globally.
Console Video Game Statistics
Console gaming continues to play a critical role in premium video game experiences, driven by exclusive titles, hardware cycles, and ecosystem-driven spending.
Here are the most important console video game statistics:
- Console video game revenue reached $45.9 billion in 2025, making it the fastest-growing segment with 5.5% year-over-year growth.
- The global game console market generated $24.8 billion in hardware revenue in 2025, reflecting steady demand across major regions.
- Console gaming content market value reached approximately $40.3 billion globally, driven by software sales and digital content purchases.
- PlayStation Network recorded around 123 million active users worldwide, highlighting the scale of console gaming ecosystems globally.
- PlayStation Plus reached approximately 47.4 million subscribers, while Xbox Game Pass and Nintendo Switch Online each surpassed 34 million users.
Also, some more snapshots of leading console hardware sales worldwide:
| Console | Lifetime Sales |
| PlayStation 2 | 155+ million units |
| Nintendo Switch | 143+ million units |
| PlayStation 4 | 117+ million units |
| PlayStation 5 | 77+ million units |
| Xbox Series X/S | 32+ million units |
PC Video Game Statistics
Unlike other platforms, PC gaming operates as an open ecosystem where distribution platforms, hardware customization, and global accessibility drive sustained growth. Important PC video games statistics:
- PC video game revenue reached approximately $43 billion in 2025, showing strong growth driven by premium game launches.
- Nearly 1.9 billion players worldwide actively play PC video games, making it the largest platform by total player base globally.
- Steam recorded over 41 million peak concurrent users in 2025, reflecting massive engagement across global PC gaming audiences.
- Asia remains the largest PC gaming region, with over 687 million players contributing significantly to global platform growth.
- PC gaming hardware market revenue exceeded $52 billion in 2024, driven by gaming laptops and high-performance component demand.
- Around 300 million players use high-end gaming PCs, highlighting a strong premium segment within the broader PC gaming ecosystem.
Video Game Player Demographics
Video game audiences now span multiple generations, with balanced gender participation and increasing engagement across both younger and older age groups globally. So, here are a few important video game player demographics based on their data:
Age Distribution of Video Game Players
- The average video game player age reached 36 years in 2025, reflecting a maturing global gaming audience over time.
- Players aged 50 and above now account for 28% of total gamers, surpassing the under-18 segment globally.
- Around 83% of children aged 5–12 actively play video games weekly, making them the most engaged age group.
- Approximately 36% of individuals aged 80–90 still play video games regularly, showing strong adoption among older generations.
Gender Distribution in Video Games
- The global player base is nearly balanced, with 47% women and 52% men participating in video games worldwide.
- In the United States, women represent 47% of all video game players, highlighting a significant shift from historical trends.
Behavioral & Engagement Insights
- Around 68% of adult players report playing video games primarily for relaxation and stress relief purposes.
- Over 82% of parents who play video games engage in gaming activities with their children, strengthening family-based interactions.
Here’s a structured breakdown of global video game demographics:
| Demographic Segment | Key Insight |
| Average Age | 36 years |
| Age 50+ Players | 28% of total players |
| Under 18 Players | 23% of total players |
| Gender Split | ~48% female / 51% male |
| Top Motivation | Relaxation and stress relief |
| Family Engagement | 82% parents play with children |
Video Game Engagement and Playtime Statistics
Player engagement in video games continues increasing globally, with longer sessions, higher frequency, and deeper interaction across platforms and genres.
Time Spent Playing Video Games
- Console players spend approximately 50 hours per month on PlayStation 5, reflecting strong engagement in premium gaming environments.
- PC and console players typically average 2–4 hours per session, depending on genre and gameplay intensity levels globally.
- Mobile players engage differently, averaging shorter sessions of 5–8 minutes but opening games multiple times daily.
Weekly Engagement Patterns
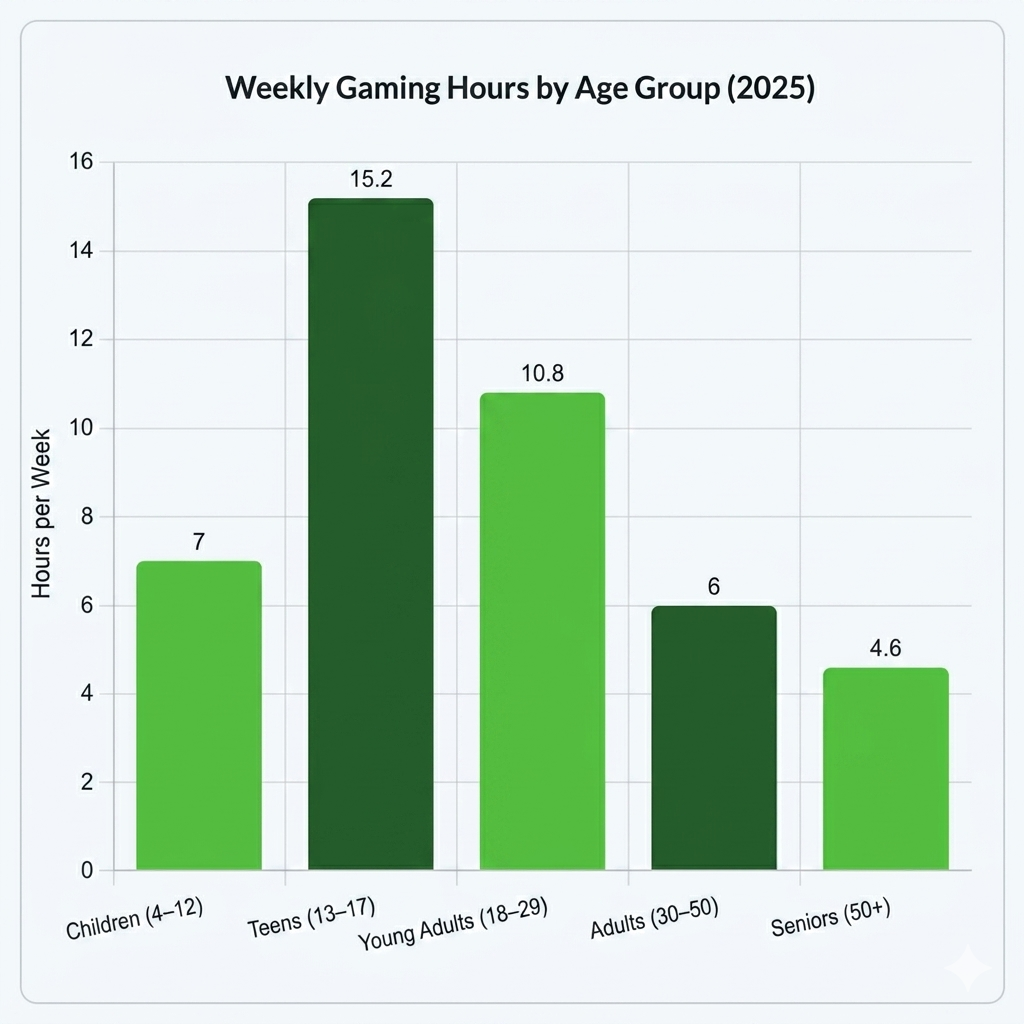
- Adult gamers spend an average of 9.7–10 hours per week playing video games across different platforms globally.
- Senior players aged 50+ average around 4.6 hours of weekly gameplay, showing consistent engagement across older demographics.
- Competitive and multiplayer gamers often exceed 10 weekly hours, driven by live-service games and social gameplay experiences.
Behavioral Engagement Trends
- Around 60% of adult players play video games weekly, highlighting consistent engagement across global gaming audiences.
- Approximately 83% of children aged 5–12 play video games weekly, making them the most active engagement segment globally.
- Players increasingly return daily, with mobile gamers opening games 4–6 times per day on average globally.
eSports and Competitive Video Game Statistics
Competitive video game events now define audience scale, prize value, and streaming intensity across the global games ecosystem.
Here are the most important eSports and competitive video game statistics:
Audience Scale
- The total esports audience will surpass 640 million in 2025, according to Newzoo’s global esports outlook.
- Esports enthusiasts will reach 318 million in 2025, showing the size of the core competitive gaming audience.
Event Scale
- The Esports World Cup 2025 reached 750 million viewers worldwide, making it one of the most-watched esports events ever.
- EWC 2025 generated 350 million hours watched, reflecting massive live viewing demand across competitive games.
- Peak concurrent viewership reached 7.98 million during the League of Legends tournament at EWC 2025.
- The 2025 Esports World Cup brought together 2,000 players and 200 clubs from 100 countries across 25 tournaments.
- The EWC 2025 prize pool exceeded $70 million, reinforcing the scale of top-tier competitive video game events.
Here’s a short snapshot of the biggest competitive event metrics:
| Metric | Value |
| Total viewers | 750 million |
| Hours watched | 350 million |
| Peak concurrent viewers | 7.98 million |
| Players | 2,000 |
| Clubs | 200 |
| Countries | 100 |
| Tournaments | 25 |
| Prize pool | $70M+ |
Video Game Monetization Statistics
Video game monetization today is driven by multiple revenue streams, with in-game spending becoming a dominant contributor across major titles globally.
Here are the most important video game monetization statistics:
- Microtransactions accounted for 58% of PC video games revenue in 2024, generating approximately $24.4 billion globally.
- Downloadable content (DLC) contributed around $5.3 billion, representing nearly 14% of total PC video game revenue worldwide.
- Premium game sales generated $10.7 billion in 2024, accounting for approximately 28% of total PC video game revenue globally.
- Electronic Arts generated approximately $5.46 billion from live services and extra content, showing the scale of recurring monetization.
- Activision Blizzard generated around $5.8 billion through microtransactions, subscriptions, and DLC across its video game portfolio.
- The global video game subscription market reached approximately $7.8 billion, reflecting growing adoption of recurring revenue models.
These were video game statistics that highlight the scale, evolution, and performance of the video game marketing industry, providing a clear data-driven view of its global landscape.
Also Check: 60+ Mobile Game Statistics Shaping the Industry in 2026
Conclusion
The video game industry is never easier. But it continues scaling globally, because of strong player demand, platform expansion, and evolving monetization systems across ecosystems. From market size and player growth to engagement, esports, and monetization, these statistics reflect how the industry operates today.
Understanding these video game statistics helps identify where revenue is concentrated, how players behave, and which platforms drive the highest engagement.
As competition increases, relying on accurate video game insights becomes essential for making informed decisions across development, publishing, and marketing.
If you’re looking to scale your game with expert video game marketing, we’re here. At Bizzware, we help you promote your video games that reach the right audience. Contact us today to get expert help!
Sources: Grand View Research, Statista, Newzoo, Newzoo, Statista, Statista, Statista, Computer Info Bits, ESA, CoopBoardGames, eSports World Cup, TechSpot, Statista